Tuesday, August 18, 2015

Checking in

I haven’t posted in a loooong time, and I have not traded any energy stocks since then.  I’m still holding a bit of Whiting Petroleum (tragically).  And have not bought back into any of the other names I had owned at the start of last summer: Chevron, Chesapeake, Apache, Freeport Moran, and later briefly EOG.  

My sense is that we are not nearing the end of the troubles for oil companies.  These are my thoughts on US focused E&P companies a the moment:

1) Efficiency gains by drillers have been impressive

I would say that it was fairly obvious that the breakeven oil price would decline significantly as prices started to decline.  There was already a trajectory of improving economics even before the price declines, but the falling oil price caused costs to fall even more dramatically.  Improved economics (at a given price) have come from several different causes.  The most obvious is service cost declines.  When the rig count drops from 1800 to 800 there is more equipment and more people chasing an ever smaller amount of work.  The result is service cost deflation.  Secondly, more speculative efforts, like proving up new acreage, drilling outside of core areas, or drilling wildcat exploratory wells has declined.  The rigs that are working are drilling wells that the operator has plenty of confidence in.  As those more marginal areas are abandoned, the average amount of oil produced per well increases.  Finally, drilling was already improving prior to the start of price declines in 2014, as things like frac designs and better drilling accuracy were delivering ever improving results.  This process has continued.

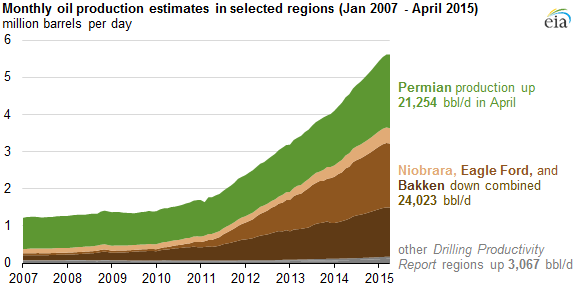
Permian, Bakken, and Eagleford new-oil production per rig (from EIA drilling productivity report) are all up 40-50% yoy.  Bakken and Eagleford production have peaked for now because of the huge drop in rig count, but there is little doubt that production would come back strong if oil prices were to stabilize even at $70.  When the crash started, many analysts would talk about “break even” prices above that figure.  Now breakeven for single well economics is $40 or lower in the core areas of the big three oil regions. 


Source: Baker Hughes


2)      Better break-even cost on new wells cannot necessarily save highly levered companies. 

Their hedge books are much weaker than a year ago.  Many of these companies have made more on their hedge books than on actually producing oil as the price of oil has fallen.   In January of this year, most companies were somewhat protected because they had hedged a portion of their production at very high prices.  That will be much less true 6 months from now.

Their debt service costs are going to increase as they roll over debt.  For small E&P companies, they will have to issue new debt at much higher interest rates than they did a few years ago.

Price declines a year ago were somewhat offset by increasing production, this will be not be the case going forward.  There was a big backlog of uncompleted wells.  For a while they could cut capex but keep production strong by completing wells out of their inventory.  That will be less true going forward, so many companies are seeing declines in cashflow from lower prices, less hedged production, and now from lower volumes.


3) It is not clear that we need higher prices anytime soon to balance the market.

Many low cost OPEC countries have a strong incentive to try to increase production as prices decline.  If your full cycle cost is $10-15/bbl, and you need those oil dollars to fund your government, the natural thing to do when oil drops from $100 to $50 is to try to produce more.  

The US Rig count has declined from 1930 last september to 860 today.  But the middle east rig count has gone from a peak of 430 to 391 today.  There is hardly even a downward trend.  In fact, international rig counts (ex US and Canada) in general have only declined from a 2014 average of 1330, to about 1200 today.  These declines are very modest, and may not even offset increases in production from Iraq and Iran, where production has been artificially depressed by sanctions and instability.  (Source Bakerhughes.com)

IEA reports in August that Non-Opec supply will still grow 1.1 million barrels per day this year, down from 2.4 million barrels per day last year.  They predict .2 mbd decline in 2016 for non-opec supply.  OPEC supply has increased by 1.4 mbd since November’s decision to protect market share and not balance the market.  Initially that growth was driven by the Saudis but Iraq and Iran are likely to drive OPEC supply in the future.   Demand has grown at a fairly constant pace, and has not accelerated noticeably since price declined last year.  In Q2 2015 there was a record 3 mb/d of excess supply.  This is obviously not a sustainable situation.


Source: IEA.org


Conclusion: My instinct is to wait until we see some evidence that supply and demand are back in balance before buying oil stocks.  There is a possibility that many US E&P companies will be able to survive if price can recover even to $60.  But there is also a possibility that prices decline even further and we see a wave of bankruptcies.  And so I will continue to wait.


Monday, May 4, 2015

Einhorn slams "mother fracker" at Ira Sohn conference

http://www.cnbc.com/id/102645305

I actually do like his explanation into what different terms mean, and Pioneer is the company I have said numerous times is inexplicably valued.  So I agree with him on his selection of a short I guess.

But the presentation is very deceptive in a number of ways.

1) First of all I totally disagree with the notion that a company is destroying value if it has negative free cash flow, as he basically stated.  By that metric, nearly every tech startup is worthless.  If a company is growing, and it is reinvesting cash faster than it is generating it, it may be destroying value, or it may not.  But you certainly can't make the sweeping generalization that it necessarily is.

2)  You can't take the current price of oil (which is low), and then compare their costs from prior years (which is high), and then say that this means they are destroying value.  EOG has certainly been earning an economic return, yet they made lots of gas investments back in 2005 and 2006, which would be totally uneconomic at today's prices.  At the time, the price of gas was much higher.  An example of this is if I were to drill a well and sell forward the production to lock in the price, then the price of oil goes to $5/bbl for some reason and someone comes along and says "you idiot, look at all this value you are destroying!  It costs you $40/bbl to produce that oil and now oil is $5/bbl, look at what a bad idea it was to drill the well!"  Not really, I made money on the well because I was hedged, it would just be stupid to drill another well at this price...

3) When a company is in the process of shifting from inexpensive gas production to expensive oil production, as PXD was and is, then they may not be growing on a per BOE basis but they may be growing when you adjust the difference in value between oil and gas.  For instance, EOG was showing very poor growth numbers on a per BOE basis (in both reserves and production) when they were shifting to oil from gas, but in fact their cash flow was growing big time.  Einhorn points to their negative FCF and slow growth in BOE of reserves, and then says that they are free cash flow negative and not growing... that is a deceptive argument.

Unconventional oil production has certainly gone through an inefficient and chaotic period over the past half decade or so now, but this was a relatively immature technology and it has improved at an astounding pace.  The increases in efficiency are incredible.  But while I do find much of his presentation deceptively worded, and perhaps he thinks it makes his case stronger, I DO AGREE that PXD has an inexplicably high valuation, and long has.  So I like his pick, but don't buy a lot of his explanation.

Friday, May 1, 2015

Earnings Notes

Whiting Petroleum (my only current position)- Bakken Oil producer. They missed earnings but shares gained when they said they might consider adding rigs (from 11 in the back half of this year) if oil were to go up to $70 (nymex).  They said they expected to grow production in the high single digits yoy at $50 oil and spend inside of cash flow.  The vast majority of discussion was about ways to streamline costs and the technical improvements in their fracs.  They've seen costs in Bakken come down from $8.5mm per well to about $6.5mm and they think there's another 20% of cost to come out yet.  Some of the technical talk was about major improvements from going to "slickwater" fracs instead of gel-fracs.  They are seeing big improvements in the 90 day rates in the bakken.  These are on top of the improvements from the last several years related to moving to cemented liners, increasing sand, and frac stages.  The overall gist is that the economics are indeed improving on multiple fronts, and the so called "breakeven" point continues to drop.

Cabot- Dry gas North-East Marcellus Producer.  They are reporting cash costs of $.80 per mmbtu of gas, plus F&D (capex) cost of about $.45.  The wells they are drilling in North East Marcellus have estimated ultimate recoveries of 20 BCF of gas.  If all gas wells were this productive you'd only have to drill about 4 wells per day, and you could supply the whole US's gas consumption with about 60 rigs.  They also report that they can do 80% IRRs on $2.45 gas price realizations.  Its not even low gas prices that are holding up production, it is lack of takeaway infrastructure.  Capacity out of North East Pennsylvania is set to double to 12 BCF/d over the next four years.  If you have any thoughts that natural gas prices might go up significantly in the USA, listen to their conference call.

Range Resources- South East Marcellus producer.  Similar themes to Cabot.  The resource size is hard to conceive, and cost continue to go lower.  In Range Resources's 400,000 acres they may have enough gas to satisfy US demand for 6-8 years at current consumption levels, based on their resource estimate for the Marcellus, plus the Utica and Devonian potential for the same acreage.  The stock has been hot for the past few weeks.

Those are the only transcripts I've read.

The majors crushed earnings estimates
Exxon at $1.17 beats by .35
Total at $1.13, beats by .28
BP (NYSE) $.82, beats by .22
Chevron $1.37, beats by $.57

Almost all of the beats were due to refining, transportation and chemicals.  It is rather amazing that estimates could be that far off and so consistently.... some of these companies had only half of their earnings from upstream.


US inventories are still building, but only at 1.9 million barrels last week, though some of this moderation in the build may be due to seasonality, as we are starting to get into a seasonal draw period as the refineries run at a high utilization rate into the summer.

Wednesday, April 15, 2015

keep the bullish inventory data released today in perspective

Today the EIA data release showed 1.3 million barrel build vs 4 million barrel expected build, hence the crude rally today.  Now normally crude inventories peak in may, decline through September, then build again through December.  So we are approaching a seasonal peak right now (see chart below).

This is the third bullish indication we have had in the US in the past week.

1) US Oil Rig count decline of 40 last friday (from baker hughs) represents another downward acceleration after two weeks of very small declines of 10 and 11.

2) Drilling productivity report from EIA earlier this week predicts declines in production in Bakken and Eagleford starting last month.

3) Inventory build rate slowed this week, according to today's EIA release, possibly suggesting a peak.
Stock price graphs

EIA data is now predicting production declines for this month and the incredible inventory build rate may finally be slowing, and inventories may even be peaking.  We remain a large importer of crude and the timing of those imports, as well as the timing of refinery maintenance has a large effect on inventories, so it will take several weeks to see if we are truly done with the build.  We may indeed be at a turning point both in that production is peaking and that our historic inventory build this winter is running out of steam, but this is not a certainty.

We also need to keep the Iran situation in the back of our mind.  I don't know how to handicap a deal and the end of US sanctions.  But I think that the highly effective sanctions that have been in place since 2010 are coming to an end, one way or another.  The Russians have announced a deal to trade crude for missiles.  This is one of the ways that Iran can skirt sanctions.  The US banking restrictions are a hugely effective tool, and crude exporters must go to great lengths such as buying oil with physical gold, as Turkish traders are almost certainly doing.  If Russia set out to skirt the sanctions using barter: trading grain or weapons for oil, they could probably soak up all the Iranian exports then re-export at a profit.  Even if congress kills a deal with Iran, it is hard to see how the sanctions regime can hold up now.  Because of the actions of Netenyahu and Congressional Republicans, it will appear to the rest of the world that we were not negotiating in good faith.  We need Russian and Chinese cooperation for the sanctions to be effective and it is hard to see how that happens going forward if a deal is not reached.  The bottom line is that I expect Iranian crude is likely to come onto the market this summer one way or another.

middle eastern rig counts skyrocketing, has not been widely reported

I did buy some Whiting Petroleum yesterday.  Partly because of the start of declining production in the USA and partly just FOMO.  It did feel a bit like chasing.  This is my second purchase of Whiting this year after I bought then sold it earlier.


Something that I have not heard discussed often is that the middle eastern countries are increasing their investment and rig counts to unprecedented levels.

MiddleEastRigCount

There are a number of plausible scenarios for this.

1) They are replacing fields that are in terminal decline.  The additional investment may be a signal that they are having more and more trouble keeping production levels flat.

2) They have changed their policy and started ramping up in 2011 for their market-share grab of late 2014.

3) They want to lower the price of oil and bring forward their production, because they are worried that they will get stuck with "stranded" oil if the world were to switch away from fossil fuels 30-50 years down the road.

It may be several of these and other factors.  But to me, the idea that they are having trouble keeping up production doesn't ring true based on their other behavior.  For one, the fact that the Saudis are now producing at record levels of 10.1 mmbd does not suggest difficulty with keeping up output.  However the ramp up may be in anticipation of a decline at the Gawar Field, which produces over half of their oil.  In fact, Gawar, has produced about 65 billion barrels of oil, or about 60% of total historic Saudi output.  As of 2008 it was supposed to have had another 60 billion barrels of reserves.  This is pure speculation though.

If I were the saudi's I would want to have a lot of spare capacity and inject a uncertainty into the future price of oil that would make it difficult to plan for large high cost projects in high cost areas like Brazil or the Gulf of Mexico.

Tuesday, April 14, 2015

New EIA drilling productivity report out today shows Bakken and Eagleford peaking two months ago


It seems that production has peaked in three of the two of the three major basins.  It is showing some signs of leveling out in the Permian as well.  Now that the decline has started, I would expect an acceleration in declines as we go forward, especially in the Bakken.  The market may still be oversupplied for some while, even as production declines and maintenance season ends at refineries, but certainly this is a significant moment.


Part of this decline in production may be due to the well documented current tendency of deferring well completions.  Essentially this is oil in storage.  There are a number of reasons to do this.  “Completing” a horizontal tight-oil well can cost substantially more than drilling it.  By waiting as service costs come down, the E&P company can improve the financial return on the well.  They can also sell the oil forward for when they know it will be completed, and since future prices are higher than spot prices (contango) they will lock in a higher price than if they were to sell that oil today into the spot market.  I am aware of this effect, but I don’t think that it should be over-emphasized.

Wednesday, April 8, 2015

Shell to Buy BG Group, the biggest E&P deal in a decade

Shell announced their intention to buy BG group for $70b.  BG, formerly British Gas, is not so well known in the USA, but they are one of the largest gas E&P companies in the world, and perhaps the largest European E&P.  I think this is the largest E&P deal since Exxon bought XTO during the gas bubble of 2008 for $40 b- a terrible deal for Exxon.

The purchase price of $70b comes out to 7.7x trailing EBITDA.  It also comes out to $10.7 per bbl of P1 reserves (their reserves are about 80% gas), and $115,000 per daily flowing barrel.  These are all pretty high multiples for a gas company I think (even a non-US gas company), but a big part of the price might be their LNG infrastructure.  It is interesting that shell has chosen a company that was not at all distressed, though certainly their share price had fallen over 40% from a high last summer.

Saturday, April 4, 2015

A comparison of three large-cap exploration and production companies

Today I have started to review the 10k reports from exploration and production companies with an eye on their year end reserves.  This is a nice time of year to compare various companies because they all disclose so much information in their annual reports.  I also thought it would be interesting to show how “quality” can be analyzed by the historical data presented in their 10k reports.  I’ve focused on three large cap diversified companies .

EOG- Originally spun out of Enron Corporation as “Enron Oil and Gas”, EOG is widely considered the highest quality shale company, and for very good reason.  They have proved adept at discovering new plays (we can give them credit for both Bakken and Eagleford), but also for recognizing an important macro trend in the industry and shifting away from gas drilling early on.  They also have very good cost control and operational performance and have managed to build land positions through leasing rather than expensive purchases from other oil companies. 

Anadarko- this is a well-managed company, though probably a tier below EOG.  They are experts at offshore exploration and have made very large discoveries in East Africa (Mozambique gas), West Africa, and in the Gulf of Mexico.  They boast an incredible 65% success rate with offshore exploration and appraisal wells.   A large part of their business model is discovering new offshore fields then selling an interest to a larger partner, and they have sold $12.5b of assets in the past 5 year period.   They also have a large presence on-shore in the US in the Marcellus, Eagleford, and Watenberg (Colorado/PRB).  They may be the best at deepwater exploration, but I think deepwater is a more challenged business model than the best of onshore tight-oil.

Apache- Apache is not a well run company.  I have owned it in the past based on low valuation, but management has not performed well at all over the past few years.  Their original specialty was to buy up older fields from the majors and milk them with careful investment and good financial management.  In recent years they have tried to make a shift toward shale by buying up US assets in the Midcontinent and Permian regions and plowing billions of capex into development drilling.  Apache’s MO in recent years has been to take free cash flow from their highly profitable Egyptian operations and plow it into marginal or money-losing onshore projects in the USA (and to a lesser extent over budget LNG projects in Australia).

Looking at earnings and PE ratios can be dangerous when analyzing oil and gas companies, unless they have relatively flat production.  PE ratios are more reasonable to use for oil majors, since production and reserves change little from one year to the next.  Their capex and depreciation tend to be more in-line with each other.  In the recent years of the oil boom here in the US, the exploration and production companies are often growing production quite quickly.  It is possible to have a company that is showing little or no profit, but is in fact making very profitable investments.  One thing that I like to do is look at both production and cash-flow growth over time, and then look at free cash flow.   Oil companies don’t need to be free cash flow positive to be a good investment.  They also don’t need to be growing to be a good investment (look at Exxon over time).  But if they are neither producing free cash flow nor growing then there is a major problem.  I find that this is a good starting point when trying to understand a company.   There have been an incredible number of methods at determining capital efficiency of exploration and production companies based on various operation statistics, but to me this approach should be first.


First let’s look at how production has changed at these companies over the past several years

So from this view we can see that both EOG and Anadarko have been successful at increasing their production since 2012, while Apache’s production has declined.  But one thing to be careful of here is that the metric of “MBOE/D”, or thousands of barrels of oil-equivelent production per day, lumps low value gas with high value oil.  NYMEX oil trades at $49 per barrel.  1mmbtu of gas trades at $2.71.  To get to oil equivelant price, multiply $2.71x 5.8 (or 6) and get $16 since one barrel of oil is abotu 5.8mmbtu of energy content.  So 1 "barrel" of gas is only $16 and a barrel of oil is $49.  So a company may be investing mainly in oil and letting gas production decline, and their overall production in terms of MBOE/d might be in decline, but the value of that production may actually be increasing.  So for that reason it is useful to look at their % of oil in their production mix.


All of the companies have been shifting towards greater oil production, but Anadarko’s shift has been quite moderate, while EOG’s has been very dramatic.


The next thing to look out for is whether the reserves are being maintained.  One thing that the oil majors like Exxon, Chevron, Shell, and BP have been doing for years is under-replacing their production.  In other words, if they produce 2 million barrels of oil per day, they add less than that quantity of reserves, so that at the end of the year they show lower levels of reserves than they had the year before.  The other thing they do is replace expensive and valuable oil reserves with less expensive and less valuable gas reserves, and claim to have been successful at maintaining their reserves.  Reserve life ratio, is the number of years it would take to produce out the current reserves at the current annual rate of production.  So for this chart, I have divided 2012 reserves by 2012 average production, then 2013 reserves by 2013 average production and so on.

  
EOG has been growing their reserve life ratio and Apache has shown the most notable decline, but in this particular case all the reserves are at a healthy level.  10x is quite healthy, but significantly lower levels can be a big red flag.  Sometimes if you see very high levels of reserve life, that can also be indicative of a major operational problem.  For instance it is common for gas producers in the Marcellus, who are constrained on capacity to get their gas to market.


Next we must look at their spending pattern.  I have seen people totally ignore free cashflow in their analysis, and I’ve seen others fairly obsessed with it.  I have even heard someone say, “If a company is not generating free cash flow than what good is it to the investor?”  Well if a company is growing quickly, or if they are a commodity producer in a time of heavily depressed prices, then negative free cash flow is not necessarily any cause for concern.  On the other hand, if two companies have similar production growth profiles, but one is outspending their cashflow and the other is generating free cashflow, then this is certainly an important thing to understand.  Free cash flow can be calculated in several ways, but for oil companies I prefer to just take cash flow from operations and subtract cash flow from investing.  


This is a bit of a hard chart to look at because of the volatile nature of it.  Apache’s free cash flow has been volatile because of major acquisitions (in 2012) and big asset sales in other years.  APC’s free cash flow was impacted by the $4b payment to BP in 2011 to indemnify themselves from any liability in the Gulf Horizon spill, for which they were a non-operator/minority investor.    But other than that incident, they have maintained very healthy levels of free cash flow.

Conclusion:
The overall picture is that APA has outspent cashflow by $1.2b in the period, while both their production and reserves have been in decline, a very poor result for a period with historically high oil prices.  EOG on the other hand has generated a small amount of free cash flow ($91mm) as they have grown production, reserves, and quite dramatically increased their weighting to higher value oil from lower value gas.  Anadarko Petroleum also has an overall positive record.  They have generated a nice sum of total free cash flow over the four years ($666mm) while growing production, maintaining reserve life, and slightly increasing their oil weighting. 

But having made this determination, there is a subsequent step that is just as important, and that is valuation.  EOG and APC both deserve a higher valuation multiple than APA, because they are higher quality companies.  But indeed these companies already trade at a higher multiple.  EOG is now trading at about 12x consensus 2015 EBITDA.   Anadarko is at 11.5x.  Apache is at 6.7x.  How can we compare low quality APA trading at a cheap multiple to high quality EOG and APC trading at a high multiple?   I really don’t have any satisfactory methodology for making a selection between two companies that are so different.  It is much easier to pick between two companies valued at similar multiples.  For instance there is little question in my mind that EOG is a much higher quality company than Pioneer, and Pioneer trades at a higher multiple at 15x 2015 EV/EBITDA.  I have owned EOG, APA, and APC each at one time, and was fully aware of the quality gap between these companies.  APA turned out to be the best investment of the three, but this was largely because I owned during a period when pretty much all oil stocks were going up.


Thursday, April 2, 2015

Will the US oil export ban be lifted?

The US crude export ban is one of the bizarre quirks of American politics.  American politicians have a long history of demagoguery and idiotic behavior in the sad history of our national energy policy.

At the time it was instituted in the 1970s the US was already a major importer of crude oil.  I'm not sure if the ban was designed to be ineffectual, but there was never any impetus to end it, even in the long era of deregulation.  The US was the thirstiest country in the world, why would anyone want to export from here anyway?

Although we are still a huge importer of crude, we are producing too much light oil, when our refineries are geared towards refining heavy oil oil.  Heavy oil is more technically challenging to refine efficiently and "high-complexity" US refineries on the Gulf Coast are needed to refine Mexican, Venezuelan, and Canadian heavy crudes.  The logical thing to do would be to export light oil and import heavy oil.  But the export ban prevents this.

Obviously the ban was ostensibly intended to keep US fuel prices down.  I say "ostensibly" because in order to have this policy be successful, you would clearly need to also ban the export of gasoline and other refined products.  But we have not done this.  So millions of barrels per day of diesel is exported from the USA.  US gasoline and diesel prices will never get far below world prices, because then people would just export more gasoline and diesel out of the US to take advantage of any price difference.  So now that there is a glut of US light crude, the price differential between US and world light crude oil grades is not accruing to the US consumer, it is accruing to the US refining industry.  In fact it is a massive subsidy to the US refining industry.  The refining industry and the refining unions have the gall to lobby against lifting this ban.  I can only imagine how they would cry if congress fixed the ban and ended exports of refined products too, so that the benefits would accrue to the consumer instead of the refining industry, as it ostensibly was originally intended.

The Republicans are pushing bills through to end the ban.  Its hard to see how this could get held up or vetoed, but in the world of US Energy policy I suppose anything can happen.  The Dems could bow to the environmental left(a la Keystone), or the Republicans could put a highly offensive and wholly unrelated rider in the bill (like the abortion language in the recent anti-human trafficking bill).  Ending the ban will hurt refiners and help domestic E&Ps.

Iran thoughts

Brent prices, and to a lesser extent WTI were hit with news that the a "framework" had been reached with Iran today, and a full deal and easing of the sanctions is expected to be reached by sometime in June.  Iran supposedly has tankers full of crude ready to go, and about 1 million barrels per day of unused capacity.  Since there is plenty of inventory on hand right now, I would think this should start hitting prices across the curve right away, even on oil for delivery before the sanctions are lifted.

The 10 year chart of Iranian production below gives you a sense for about how much supply they are going to be able to add.


From oilprice.com- Can you guess when they ramped up the sanctions?


The chart above from Wikipedia only ends in 2006 but it does show the Iran production during the 1970s.

An Iran deal is also bearish for oil in the longer term.  Since there is very little prospect of cooperation between Iran and Saudi Arabia/OPEC, Iran is likely to try to increase capacity and gain market share where it can.  Presumably competent service companies and some investment could rapidly raise Iran's output.  Iran's conventional oil reserves are 2nd in the world, and total reserves are 4th.  There is certainly very significant scope to increase production if it becomes a normal country.  Iran produced over 6 million barrels per day before the disruptions of the '79 revolution.  This was immediately followed by the Iran-Iraq war of the 1980s, the very low prices of the late 1980s and the 1990s, and finally the international sanctions.  In the very long term Iran might also add to the LNG glut, since they have a ton of conventional gas and no pipeline exports.  The logical thing from a logistical standpoint would be an export pipeline to Pakistan and even India, though the geopolitics of all that make it seem a rather remote possibility.

Of course there are various parties who want to scuttle this thing on both sides, so it may not be a done deal yet.


Friday, March 20, 2015

EIA predicts month-over-month declines at main tight oil basins (same news as previous post but now with chart)

graph of monthly oil production in selected regions, as explained in the article text

Of the three basins where the vast majority of recent production growth has been, two are now predicted by EIA to decline in April.  There is a chance that we are seeing the peak in US production.  Unfortunately, the market will still be far from balanced unless we get significant declines in production or increases in demand.  Crude stocks have been building in the USA by just under 1 million barrels per day for the last 90 days.  Now some of this is due to refinery turn-around season, perhaps 1/4 to 1/3 of the build if the past five year history is a model.  We have had fairly high utilization rates during this turnaround season, which should have minimized the crude build under normal circumstances.  Gasoline stocks are significantly above average as well.
Stock price graphs
Also, since we are a net importer why has our over production not simply displaced imports?  The only answer that makes sense to me is that we have fully displaced all light crude imports and the refineries still are importing heavy crudes since that is what they are set up to refine.  Almost all of the crude being produced from the tight oil plays is light crude.  So the build in inventories is not just a sign of overproduction, it is a sign that there is a miss-match  in the type of oil that is being produced and what the refineries want.


Graph of monthly crude oil imports to the U.S. Gulf Coast by type, as explained in the article text

This EIA article from february shows how light crude imports have totally disappeared, and medium crude imports are on their way out too.  I don't think there is available data showing how much inventory is which type of crude, but you can bet that the vast bulk of it is light crude.

So how do we get out of this situation of US inventory builds?

1) major increases in consumption- Hard to see this happening in as significant a way as it would need to to make a major impact.  Even with very big consumption growth it couldn't really solve the glut of light oil, though it could make a dent in the global supply-demand balance.

2) US ends the oil export ban.  This is an incredibly obvious thing to do, and just the type of bill the republican congress would love to pass.  This is the easiest solution, but I would hate to be in the position of relying on the government to do something.  If this happened we would be importing heavy oil and exporting light oil.

3) Refineries switch over to lighter grades- My non-expert sense is that this isn't something that happens fast.  Also, only some switch-overs in the US Gulf Coast might create a glut of the heavy grades that come from Canada, Mexico, and Venezuela supporting the economics of those grades as well and disincentivizing massive change-overs to light grades.  I don't think this solution is likely to be rapid enough to address the problem.

4) Exports of "lightly refined" crudes-  This is what Valero and Pioneer did with lease condensate exports.  They run it through a simple distilation tower and call it a refined product, which is thus eligible for exports.  NGLs have always been exportable too.  But why not go heavier and push the envelope further?  I don't know enough about the rules to say whether this is really practical.

But if nothing happens, you could see even more egregious discounts for Eagleford and especially Bakken grades.  Although spreads haven't apparently totally blown out yet, I would point out, that in percentage terms, the discounts are very high indeed.  A $15 discount to Brent is more than 25% at current prices.


Wednesday, March 18, 2015

How likely is an Iran deal?

If I were Iran, I would view the current period as a golden opportunity for a nuclear deal.  The senate Republicans and Netenyahu have presented the Iranians with something of a win-win situation if they have any intention at all of making a deal.  For one, if the Republicans are able to scuttle a deal that the Obama administration signs onto, then that may well cause the sanction resolve of China and Russia to weaken.  If the US isn't willing to negotiate in good faith then how can Iran be faulted?  So they might be able to sign up for a deal, and when the Republicans vote it down they can resume previous activities while blaming America.  On the other hand, if the Republicans aren't able to scuttle the deal, then the Iranian moderates have some serious political cover.   They can say: Look how good this deal was for us, Netenyahu hated it so much that he breached normal diplomatic protocol to give a speech in the US Senate.  The Republicans hated it so much that they wrote an unprecedented letter to the Supreme Leader that was resulted in various political commentators calling them traitors.

Any Iran deal is bearish for oil over both short and long time horizons.  If Iran actually became a normal country, their production might dramatically increase over the long term.  Today they export 1-1.5 million barrels per day.  But they are only producing 3 or 3.5 compared to 5.5 million per day which they produced in the 1970s before the revolution.

Updates and inventories

I mentioned a week ago that I had picked up some Whiting on the back of takeout rumors.  I sold that position back for a very small gain yesterday.  Just as everyone had been focusing on the declining rig count in January and February, now everyone seems focused on the US inventory numbers, which are at a record and moving ever higher.  Cushing inventories are around 70% full according to someone on CNBC yesterday.  If we really run up against storage limits, there will be no limit to how far the price can fall in the short term.

I had last posted about the US inventories a few weeks ago.  I just wanted to reiterate a few points.

1) US inventories are not world inventories.  US inventories have very reliable data from EIA, so they are  a major data point that everyone focuses on, but the US only uses 20% of the worlds oil production now.

2) It is not clear how much the US build is due to total excess supply of oil and how much is due to the specific glut of light oil from the unconventional plays.  This oil cannot be exported except under a few specific circumstances.

3) The refinery turnaround season has also had an effect on the inventory build.  Utilization tends to be highest in the summer and low in the winter, so we are coming off a period of low refinery utilization which causes inventory builds.

Now that EIA is predicting declines in Bakken and Eagleford, and refinery utilization rates should be on the upswing, perhaps we will soon see an end to the dramatic inventory builds.

Monday, March 9, 2015

New EIA drilling productivity report shows production in Bakken and Eagleford may be declining in April

EIA is now predicting Bakken and Eagleford production declines in April.  Permian still is increasing, and all the tight oil regions taken together have flat production.  If this is true it means that US production will be peaking before many analysts were expecting.  This is a bullish sign for oil equities.

Whiting up for sale?

Whiting is up 10% this morning and I just bought a chunk at 37.55. This is the first purchase I have made in energy since last September.

Bloomberg and WSJ are both reporting that it is up for sale.  The price is right, trading at under $10 per barrel on a P1 basis.  There are deepwater projects that have recently been approved on a $20 per estimated recoverable barrel basis.  Statoil and Exxon are logical buyers since they have plenty of firepower and are already heavily involved in the Bakken.  PE is also a possibility since there has been lots of fundraising activity recently.

Sunday, March 8, 2015

Inventories and Rig Count update

I haven't had much time recently, but I did want to check in on inventories and rig count.

Rig counts are still heading south at an incredible pace with the numbers from Baker Hughes showing another drop of 75 last week.  Inventories continue to climb at a rapid pace in the USA.


Beyond this, we are seeing continued delays to completions.  Because the market is in reasonably steep contango, an oil company can delay completion on the well and sell the oil forward to lock in a higher price than they would get if they turned it on today.  As an added bonus, service costs are falling, so the cost of completion will be lower 6 months from now, or so everyone expects.  This means that the US inventory builds, as impressive as they are, might actually be understated.


The monthly International Energy Administration publication the Oil Markets Report from January is now available for free (you have to pay to get it on time).  They are now showing the market in balance (but not working off elevated inventories) beginning in Q3 and Q4 of this year.  They note that there was a downward revision of 350mbbl/d for non-opec supply growth.  They also project about 1% growth rate for demand this year, up from around .6-.7% for last year.  They divide oil demand into OECD, which is about half the market, and Non-OECD.  OECD demand is declining at about 2% per year, and non-OECD is growing at about 2 to 2.5%. 

Total inventories (through November, see below) are not at all alarming.  Low European inventories and high US inventories more or less are cancelling each other out.  Although it should be pointed out that the alarming rise in US inventories really started in late November, after the data shown from the IEA January report.


I think one reason for the big rise in US inventories with total OECD inventories building, but only at their 5 year average as of November, could be the overproduction of light oil in the USA.  A reason for US inventory builds might be that we are producing so much light oil that the refiners are having trouble taking it.  Even though the USA still imports a lot of oil, over the past few years, light oil imports have gone to zero.  Since light oil production is still going up, they have to find something to do with the surplus.  US law forbids exporting oil, so it may be that the inventory build is related to the overproduction of light oil in the USA as much as it is a signal of global overproduction.  If this is the case, it would indicate that US  inventories may not be particularly useful for evaluating global oil supply-demand balances. 


Thursday, February 26, 2015

OPEC may not be able to inflict enough pain to derail US shale

After listening to several of the conference calls and skimming several transcripts (CHK, EOG, RRC, WLL, CLR, APA, MRO, PXD) so far I think there are a number of broad take-aways from the US focused E&P sector.

1) The bigger companies like APA, PXD, MRO are predicting flatish growth this year, with some quarter over quarter declines towards year end.  These companies tend to be spending about within cash flow, meaning that they don't need new financing to fund their capex program.

2) Other companies like WLL, RCC, CHK are running negative cash flow but still growing at quite a rapid pace in some cases (not CHK).

3) In many cases the companies say they are waiting for either service costs to come down OR oil prices to go up.  They don't need both to happen to increase activity levels, even at the current strip.

Overall, if prices don't go down further it looks like the E&Ps  have avoided any real 1980s style bloodbath.  Smaller service companies and offshore drillers may still see some bankruptcies or recapitalizations.  A few of E&Ps also may still go bust.  Energy XXI, Tullow (international), Bill Barrett Corp, ZAZA, Swift, Sandridge and several others are trading like they might go under.  None of these are companies that I'm particularly familiar with.

I also will again point out that we will see massive efficiency gains this year in the US unconventional producers.  This will be due to operational improvements, technological improvements, and service price declines.  If oil gets back to $70 a year from now, that may be as profitable for the on-shore unconventional producers as $90 WTI was a year ago, as has been noted in some of the calls.  The most at-risk projects may be the offshore, where we have seen consistent cost growth in recent years, as tight oil sees cost per barrel produced decline.  Remember that tight oil is still only about 7 years old, and still seeing dramatic improvements.  Deepwater has been around for decades now, and the easy gains in efficiency are probably behind us.  So deepwater and tight oil may have similar breakevens right now, but who will have the advantage 5 years from now?  The answer to that question seems fairly obvious.   Ultradeepwater may be more at risk of being the victim of the current price environment than the unconventional on-shore producers.  This is one of the reasons why I'm not really looking at the deepwater drill ship operators like RIG and ESV.  The other main source of high cost oil, oil-sands, seems also to be surviving without too much trauma.

If this is as bad as it gets, has OPEC simply lost its nerve?  Was their goal only to put a bit of the fear of god into the western E&P companies?  Because if their goal was to derail US shale, $50 oil for 6 months is not enough.  It may be that the Saudis either don't have the stomach or don't have the ability to drive the price down to where it would need to go to truly cause distress to the US producers.  I remain on the sidelines, with inventories continuing to build every day, but I must admit that I am starting to find myself looking at companies to buy rather than thinking about who would be the best short.

Thursday, February 19, 2015

EOG earnings call- Joins other large-caps in guiding to flat 2015 production

EOG (formerly Enron Oil and Gas), has the well deserved reputation as the premier operator among on-shore US E&P companies.  There are certainly other companies that fall into the “premium” category, like Range Resources and Cabot in gas, or Pioneer and Noble in oil, but EOG is definitely the first among equals.  They had a bit of an earnings miss.  Here are some take-aways.


  • EOG deferring many well completions to wait for higher prices and lower service costs.  200 wells waiting on completion now, and there will be 285 at year end.
  • Capex goes from $7.5b in 2014 to $5b in 2015.  Capex more focused on infrastructure than last year.
  • Flat production yoy for 2014 to 2015.  If they are getting $65/bbl at year end they will ramp back up but stay within cashflow.  They can get double-digit growth at $65 again next year.
  • “Flat to negative US production growth on a month over month basis by the end of this year” industry wide.
  • 10-30% cost reductions in services so far.
  • Hoping for 10% reduction in total well costs this year.
  • Decline rate is slowing over time.  Partly this is due to a maturing production base (older wells comprising a larger part of production than previously).  Completion technology is also starting to flatten out decline rates.  Seeing lower long term decline rates in the higher density fracs.
  • They have a lot of their own sand etc, so they might get a bit less on cost reductions than others, since they are starting from lower.
  • With today’s technology improvements, they are seeing the same returns at $65 oil as they were seeing with $95 oil in 2012.

Regional info
Cutting back in the Bakken and Eagleford, ramping up from a low base in Permian as results improves.  All other plays will have limited activity.

  • Eagleford 345 wells this year vs 534 in 2014 year.  Running 15 rigs.
  • Bakken 25 wells this year vs 59 last year with 3 rigs.
  • Leonard Shale (Permian)- 23 wells this year vs 18 last year. 
  • Bone Springs (Permian- 37 wells this year vs 3 last year.
  • Wolfcamp (Permian)- 26 wells this year vs 19 last year.
  • Cutting back a lot on any drilling outside of the big three.

Sunday, February 15, 2015

Highlights from Pioneer and Apache conference calls last week

I skimmed the transcripts and there were a number of interesting bits.  The main takeaways were


  1. These guys are doing BIG capex reductions, which I think is an appropriate move.
  2. The current price environment certainly does not pose an existential risk to the North American focused large-cap E&Ps
  3. They are slowing down drilling waiting for service costs to come down, and not just waiting for oil prices to go up.  They might ramp drilling back up if they can get the anticipated price reductions for services, especially related to pressure pumping.


APACHE:

  • Massive capex cuts were announced.  Apache is going from 91 rigs in Q3 2014 down to 27 rigs.  They are guiding to flat production.
  • $3.8b 2015 capex guidance is a 60% cut vs 2014.
  • Wells that cost $8mm each in 2014, they were projecting $7mm for 2015.  Now they say maybe down to $6mm with anticipated service cost declines.  And there are plenty of wells that can deliver “solid economics” at the current strip price.
  •  What they are waiting for is not necessarily a rise in oil prices, but rather a decline in service costs, which will make drilling more economic.  They are even deferring completions to wait for price declines in services.  They anticipate turning more rigs on at the end of the year, EVEN IF THE PRICE STAYS FLAT AT CURRENT LEVELS.
  • 20% service cost declines they think is quite a conservative number.


Apache has not been a well run company.  I owned it for a while through September of last year because of the very low valuation, not because of any particular confidence in management. 

They also had “pro forma growth” of 12% yoy at 609 mboed.  This is always funny that someone can use the word “growth” with a straight face when their production actually declined by about 20%.  Apache sold stakes in over-budget LNG projects in Australia for $2.75b (pending).  They continue to spend money on this, which they will be reimbursed for at closing, for an additional $1b.  They sold stakes in Lucious and Heidleberg projects in deepwater Gulf of Mexico for $1.4b in announced in June.  They sold western Canada Assets for $375mm in March.  They sold their stake in Argentina to YPF announced in March as well for $850mm.  They end with $10.5b in net debt.  A year prior they had about 7.6b of net debt.  So assuming they get the $3.75b cash for the LNG projects (the extra $1b is for capex incurred since the deal was signed), which are not contributing to production, their net debt has declined slightly and their production has declined from 761mboed per day at year end 2013 down to 609 mboed at year end 2014.  They have returned cash to shareholders with the dividend and share buybacks.  401mm shares outsanding in YE 2013, and 24 million were bought back over the course of the year ($150mm at $60 per share).  $100mm was also spent on dividends.  All told though, Apache has not made good investment decisions.  We have seen net debt fall slightly (maybe $500mm) as production falls dramatically, even in a year of generally high oil prices.

I must say though, that I approve the massive capex cut strategy and it is certainly good news is they are not talking about selling their cash cow Egypt assets, which some have urged.  


PIONEER
  • Full year 2014 production was up 18% yoy to 182 mboed.   Currently production is at 201 mboed for q4.  Oil production grew at 25%.  Projecting average 2015 production to be up 10% on 2014, but with qoq declines near the end of they year.
  • 2015 capex guidance of 1.85b, 45% below 2014.
  • Reducing rig count 50% to 16 rigs in Spraberry (Permian basin) and Eagleford.  They are shutting down all vertical rigs.
  • Assuming $9mm for a 9,000 ft horizontal well in the wolfcamp for 2015, but he says that is quite conservative and it might end up being lower.  This would give them 55% irrs at the strip pricing.  This is benefiting from a 20% service cost reduction plus improving well performance.
  • They say they can get similar returns at $70 as they were getting at $90 if the anticipated cost reductions come through.
I think they are taking the correct actions in the current environment.  I still think they are overvalued with a $23b market cap.

Wednesday, February 11, 2015

Iraq and Iran- other reasons to worry about oversupply

Its easy to be overly focused on North America because of the detailed disclosures, and because that is where the major production growth has been over the past few years.  But Iraq has been a huge source of production growth over the recent months.  Historically they have fluctuated between 1 and 3 million barrels per day over past decades, depending on wars and insurgencies etc.  Last December they reported that they produced a record 4 million per day.  The Iraqi oil ministry has previously stated that they have the intent to produce 9 million a day within a decade!  There is no doubt that they have the fields to do it, it is just a question of stability, attractive fiscal terms, and political will.  Although ISIS has periodically threatened supplies, production has actually been growing in the ISIS era.  Also, recent agreements between Kurdistan and the central government have allowed Kurdish oil in the north to flow more freely, and this is also indicative of further increases in production going forward.

Iran has also been an under performer ever since the fall of the shah.  In recent years production has declined to 3 million per day, partly because of the sanctions.  If a nuclear deal were reached production could potentially go up dramatically.  It could even double.  Who knows how likely this is.  But if you hear "nuclear deal has been reached" this is definitely long-term bearish for oil prices.

On the other side of the ledger, I think there is some risk that Russia, the world's largest producer, could see declines due to sanctions, especially if we get stepped-up sanctions due to further deterioration of the Ukraine situation.  In fact it was a collapse in Russian production that softened the 1980s glut, after the economic collapse of the Soviet Union.  Another possibility is that Russia cooperates with OPEC to prop up prices.  In the past the Russians have said that because their industry is in private hands they have no way to cut production.  No one believes that.  Certainly Putin could tell them to cut production, and they would do it.  It makes sense for Russia to cooperate with OPEC.

Drilling productivity and a look at year over year production numbers

Region New oil production per rig YOY Total Production YOY growth
Eagleford 23% 32%
Bakken 26% 31%
Permian 11% 28%
Niobrara 28% 23%
Utica 74% 14%


The new EIA drilling productivity report came out yesterday.  There was no real change in trend.  Efficiency gains continue at about the former pace, as does production growth in the key regions.  We have seen no obvious effects yet from the capex cuts.  The rate of growth of the big three unconventional oil plays (Eagleford, Bakken, Permian) clearly will have to slow down at some point.  But currently we are seeing no signs of production flattening out, let alone declining.

In percentage terms the rate of growth in Bakken and Eagleford is indeed slowing: for instance in calendar year 2013 production in the Eagleford grew at about 46%. vs 32% this year.  But this is just because there is a higher total production.  The rate of growth in terms of barrels per day of production was higher in 2014 at about 450,000 b/d growth in crude production, vs 391,000 b/d growth in 2013 for the Eagleford.  Total production is now 1,715,000 B/D making it a top 5 oil field in the world.

Bakken grew production by 314,000 b/d in 2014 vs 198,000 b/d growth in 2013.  Total production is now about 1,300,000 b/d.

The rate of production growth in the Permian has actually been accelerating since oil started to drop.  It grew by 420,000 b/d in 2014, compared to only 202,000 b/d of production growth in 2013.  Total production is 1,962,000 b/d.


I also want to not once again that rig productivity is increasing at a very steady pace.  In the Utica, the 74% increase is off a very low base, so it isn't as impressive as it might seem.  Whenever you hear someone say, "you need $60 oil to make money drilling in the bakken", it may lead you to think about the economics of drilling in overly simplistic terms.  For one the "breakeven" point is a moving target that is always moving lower due to the rapid efficiency gains.  Secondly, service cost increases or decreases can further distort this number.  And finally, it is important to keep in mind that economics vary wildly from one area within the region to another.  I believe that rig productivity numbers may soon start to increase at an even faster pace as inefficient operators and those with poor quality acreage shut down their rigs first.  One anectdote is the report yesterday from Pioneer Resources, a Permian and Eagleford focused E&P.  They intend to cut capex by 45% but they are still planning to grow oil production in 2015 by 20%.   I know of no companies that are projecting declines in North American oil production this year (the oil majors are in perpetual production decline, but this is mostly from overseas).  If the goal of OPEC/Saudi Arabia is to balance the market, then we are still going to have to wait.  We are not seeing signs of production declines from the major high cost producer (us).  


Wednesday, February 4, 2015

just cut my whiting position in half today at 36.95 after the big rally over the past few days

Of the several mistakes I've made, not selling Whiting when I sold FCX, APA, CVX, CHK in July-September period was the biggest mistake.  Another mistake was buying EOG in September, but at least I got out of that in December with only a 3% loss or so.

I have almost no money in E&Ps now, so I'm certainly anticipating another leg down.  

Tuesday, February 3, 2015

Anadarko Petroleum Conference call, commentary on service costs

Anadarko is one of the largest US based exploration and production companies had their conference call today.  They are a deepwater exploration specialist, but also have considerable on-shore US assets in the Wattenberg (Colorado, oil), North East Marcellus (Pennsylvania, dry gas), and Permian Basin.

I skimmed the transcript and didn't see anything to earth shattering.  There was an interesting comment on service costs:

"Okay, I will start with this and I will see if I can get Chuck Meloy to also to give you a few thoughts from him. If you think about the fact that onshore today, unlike say ten years ago, around 70% of our costs are now in completions, whereas 10 years ago 70% of the costs were in actual drilling of the wells, and 30% were in completions. As a result, as we’ve looked at this and comments I made in January at a conference would concur with and get ready to tell you that simply we don’t see this being a quick change to the service cost environment simply because we are going to honor our contracts and I think so will the industry.
We are in this with the service companies as partners. As we move to sync up those costs however I think you can anticipate that maybe by the end of the year, early into the next we could see significant reduction in service calls. If we were fortunate enough to be able to find a [indiscernible] to save 20% reductions in service calls and you think about it being in a prior world at $90 per barrel and the economics they gave us at the well head, $70 could be the new $90 or $90 could be the new $70, however you want to look at it."
The implication here is that service costs may not have the scope to drop to the degree seen in prior busts because of the make up of those costs.  I don't really understand why completion costs are less flexible than drilling costs, but if this is true then I will have to temper my expectations for cost reductions.   Actual declines in service costs are only one area where E&Ps can increase drilling efficiency.  It is important to remember that drilling efficiency had been increasing steadily prior to the oil price declines without cost concessions from service providers.

oil up over 10% in past few days, I'm not buying the rally

When waiting for a tremendous bargain, as oil stocks go down and down, there is a big temptation to buy when we get an up move for fear of missing the opportunity.  I don't think we are there yet.  Capitalism works because a decline in prices sends a signal to producers to produce less.  There is a saying in the world of commodities: "the cure for high prices is high prices".  And of course the corollary of this is that the cure for low prices is low prices.  I do think that we are now below the long run average price that oil needs to be at to spur sufficient production to meet world demand.  But I don't think we are as far below that price as some seem to think, and certainly oil does not have to be at $90 per barrel or higher.   We have  too much production for world demand now.  In the USA, one of the highest cost producers, where you would expect to see the biggest declines after a price correction, we have seen big capex cuts.  But not a single producer has signaled that their production will decline.  In fact, monthly data from EIA continues to show production increases, and we haven't even started to see the rate of increase slow (the 2nd derivative of oil production, if you like).

Rig count cuts and capex cuts are not enough to solve the short term problem.  BUT they may be enough to convince the Saudis to try to boost the prices a bit towards $70 or so.  If they think that their actions have had the desired effect of reducing long term supply in the USA and other high cost areas, then perhaps they will try to create the conditions for a price rise. They are still talking down the price for now.   I don't think we are there yet, and I'm not buying.

Sunday, February 1, 2015

A few bits from the Hess, Oxy, and Conoco conference calls last week

I scanned through these three conference calls from the past week.

Hess:

Cutting 2015 capex to $4.7b from 5.6b in 2014.  45% of which is unconventional on-shore US and the rest is offshore US and international.

Greg Hill, President and COO, stated: “We are reducing our 2015 spending in the Bakken to $1.8 billion, compared with $2.2 billion in 2014. In 2015, we plan to operate an average of 9.5 rigs and bring approximately 210 new operated wells online, compared with 17 rigs and 238 operated wells brought online in 2014.

“In the Utica, we plan to spend $290 million compared with approximately $500 million last year, as we transition to early development at a measured pace in this price environment and as infrastructure builds out. Over 2015 our joint venture with CONSOL intends to execute a two rig program focused in the core of the wet gas window and bring 25-30 new wells online, compared with four rigs and 39 new wells in 2014.

In their supplemental info they also show how well costs are down to $7.1mm from the quarter, down from $8.6mm in Q1 2013.  They expect to get cost reductions from suppliers.   800-900 mboed for IP30s- 175,000 mboed is their target for the bakken eventually.  So they are cutting the rig count by half and yet expect to drill only 12% fewer wells compared to last year in the bakken.  They also say they can keep production at least flat with this reduced rig count.  As I've said many times, there is unlikely to be a steep drop off in production in the US unless there is a much steeper sell off.

Also their cost reduction projections are quite modest.  They are more or less predicting that the current trend in cost reductions will persist.  I think this is incredibly conservative, and I believe cost reductions will accelerate rather significantly.  While these companies have been pursuing efficiencies by streamlining operations before, they will benefit in the year ahead from declines in service costs, and the almost complete elimination of drilling single-well pads to hold acreage by production.

The HES transcript was from seekingalpha.com.

Conoco Phillips

transcript:  http://www.conocophillips.com/investor-relations/Pages/default.aspx

Formerly the smallest of the majors, COP is now the biggest E&P after spinning off its refining unit Phillips66.  They are illustrative of what is wrong with the major companies.  They spent $17.1b in capex last year vs. 15,800 in cash flow from operations.  And with that out-spend in a very high priced environment they managed to only replace 97% of reserves, and grew production by 4%.  I haven’t looked to see if they did the old trick of replacing oil production with cheaper gas production and claiming to be replacing reserves and maintaining production.

They are planning to run 6 rigs in the Eagleford, 3 in the Bakken, and 4 in the Permian basin.“We are in the sweet spot of the Bakken. With the rig rates and the rates that we are getting, it's economic at current conditions, but we're actually taking it all the way down to three rigs this year. We do have some commitments within some of the units in the Bakken where we have to run some rigs in the Bakken. The Eagle Ford is still very economic, even at current prices. But having said that, it makes more economic sense to defer. So what we're dealing with in the Eagle Ford is a balance of -- we have some commitments. We need to run probably three rigs to meet commitments on our leasehold. And we're also keen to continue to learn on the Eagle Ford because we have a huge inventory there that we could develop over the next couple of decades. And we want to make sure that we're capturing all the learnings.”
 In response to another question:
“Well, Guy, I think you are really trying to focus in on the unconventionals in our portfolio. So to give you a sense of that, we expect our production from the Eagle Ford and Bakken will grow from about 200,000 barrels a day in 2014 to about 225,000 barrels a day in 2015. So somewhere between a 10% and a 15% increase. Now, that production growth is all going to come through the first half of the year. And then if we stay at the rig counts that we said just now, we're going into a slow decline in both the Bakken and the Eagle Ford, not a rapid decline but a slow decline. And that's going to continue into early 2016.”

So we are seeing some projections of declines at COP for domestic US production.  This is really the first time I'm seeing an E&P admit that their US production will decline, and they seem to indicate a peak production in mid-late 2015.  Although we should note, that they are still projecting higher domestic US production for year end 2015 compared to today.


Occidental Petroleum


These guys are the second largest US E&P after COP.  They replaced 174% of reserves in 2014.  They have a rock solid balance sheet with a net cash position.  Production was flat at 591,000 boed for 2014.  From an unconventional standpoint, they are mainly concentrating on the Permian, where their biggest unconventional acreage is.  They are seeing 750 mboe type-curves in the Wolfcamp, and 900 mboe in the Spraberry.  No big takeaways for me from this conference call, except that they are cutting capex from $8.9b in 2014 to 5.7b in 2015, and that they continue to see significant improvements in the Permian.